Find the SwiftUI Views that Update the Most Using Instruments
When profiling a SwiftUI app with Instruments, one thing you want to know is what views update the most. If a view updates more than you expect, you want to know what causes the updates. In this article you will learn how to use the SwiftUI instrument to find the views in your app that update the most and find what triggers view updates.
This article uses the new SwiftUI instrument Apple added in Xcode 26. If you are using an earlier version of Xcode, read the following article:
See How Many Times Your SwiftUI Views Redraw Using Instruments
Profile your app
Take the following steps to profile your app with the SwiftUI instrument:
- Go to Xcode.
- Press Cmd-I or choose Product > Profile to build your project and launch Instruments.
- Choose SwiftUI from the template list.
- Click the Choose button.
- Click the Record button above the sidebar to start profiling.
- Click the Stop button when you are finished.
Find the views that update the most
Use the all updates summary to find the views that update the most. Instruments should show the all updates summary when you stop profiling, but if you don’t see it in the detail view, press Cmd-1 or choose Summary: All Updates from the jump bar menu.
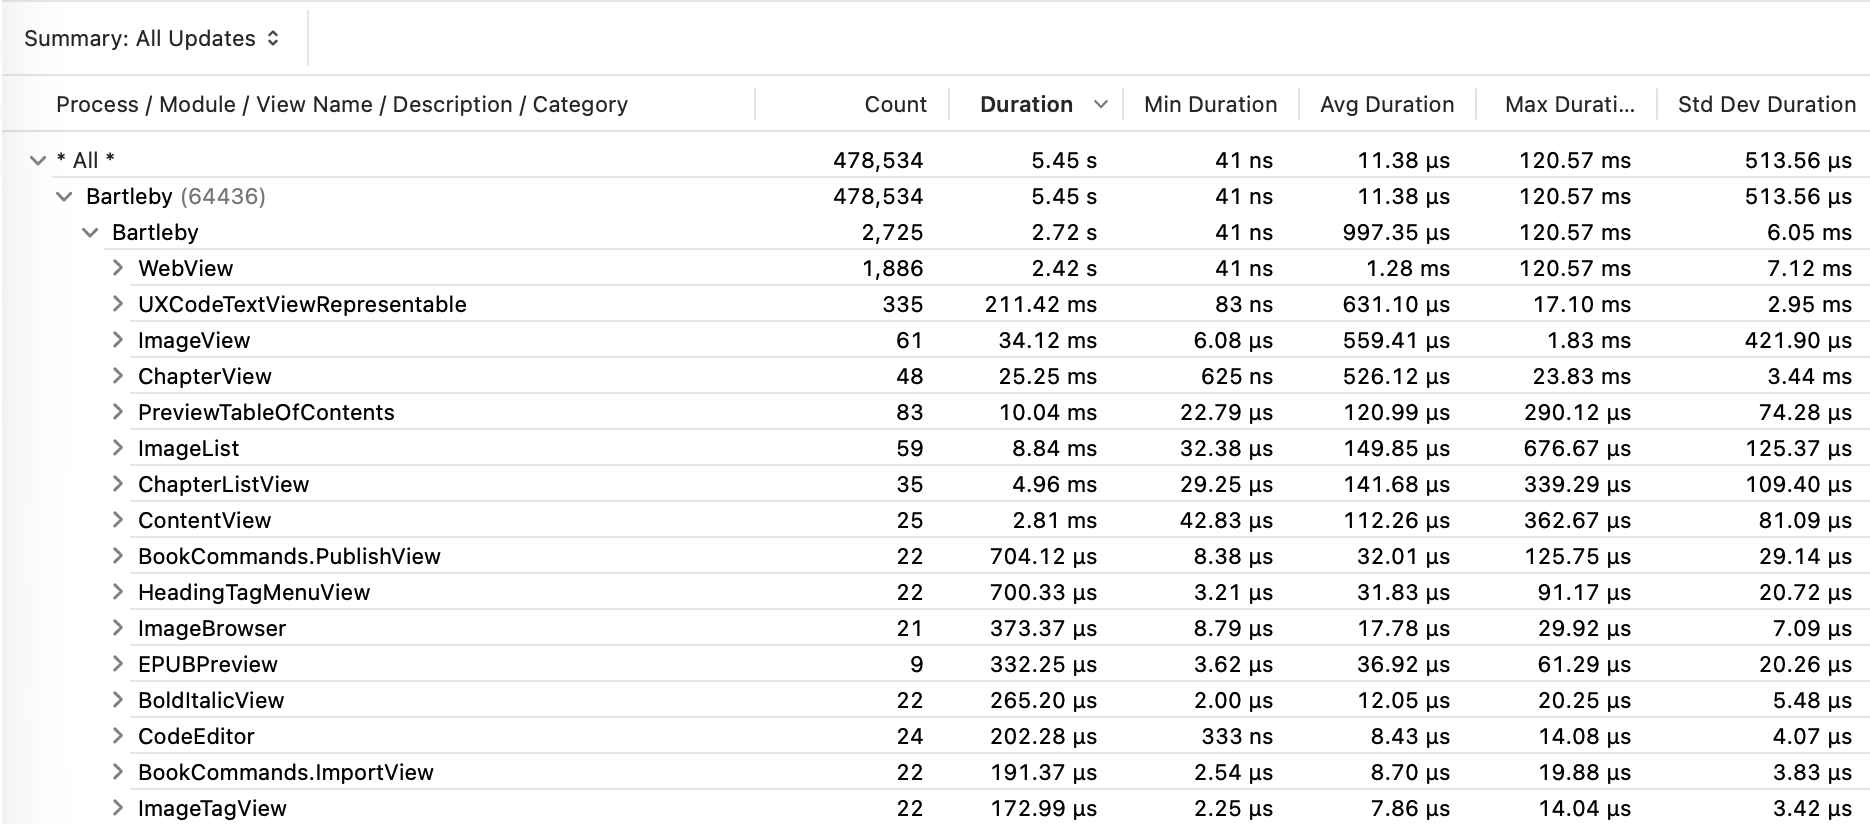
The SwiftUI instrument’s all updates summary shows the following statistics for the views in your app:
- Number of updates
- Total update time
- Shortest update
- Longest update
- Average update time
Take the following steps to find the views that update the most:
- Click the disclosure triangle next to the name of your app to see the app’s modules.
- Click the disclosure triangle next to your app’s module to see a list of your app’s views.
- Click the Count column heading to sort the views by update count so you can see what views update the most.
Find what causes a view to update
Use the cause and effect graph in the SwiftUI instrument to find the cause of view updates. Take the following steps to show the cause and effect graph for a view:
- Move the pointer over a view in the all updates summary.
- Click the small button that appears next to the name of the view.
- Choose Show Cause & Effect Graph.
The cause and effect graph looks similar to the following screenshot:
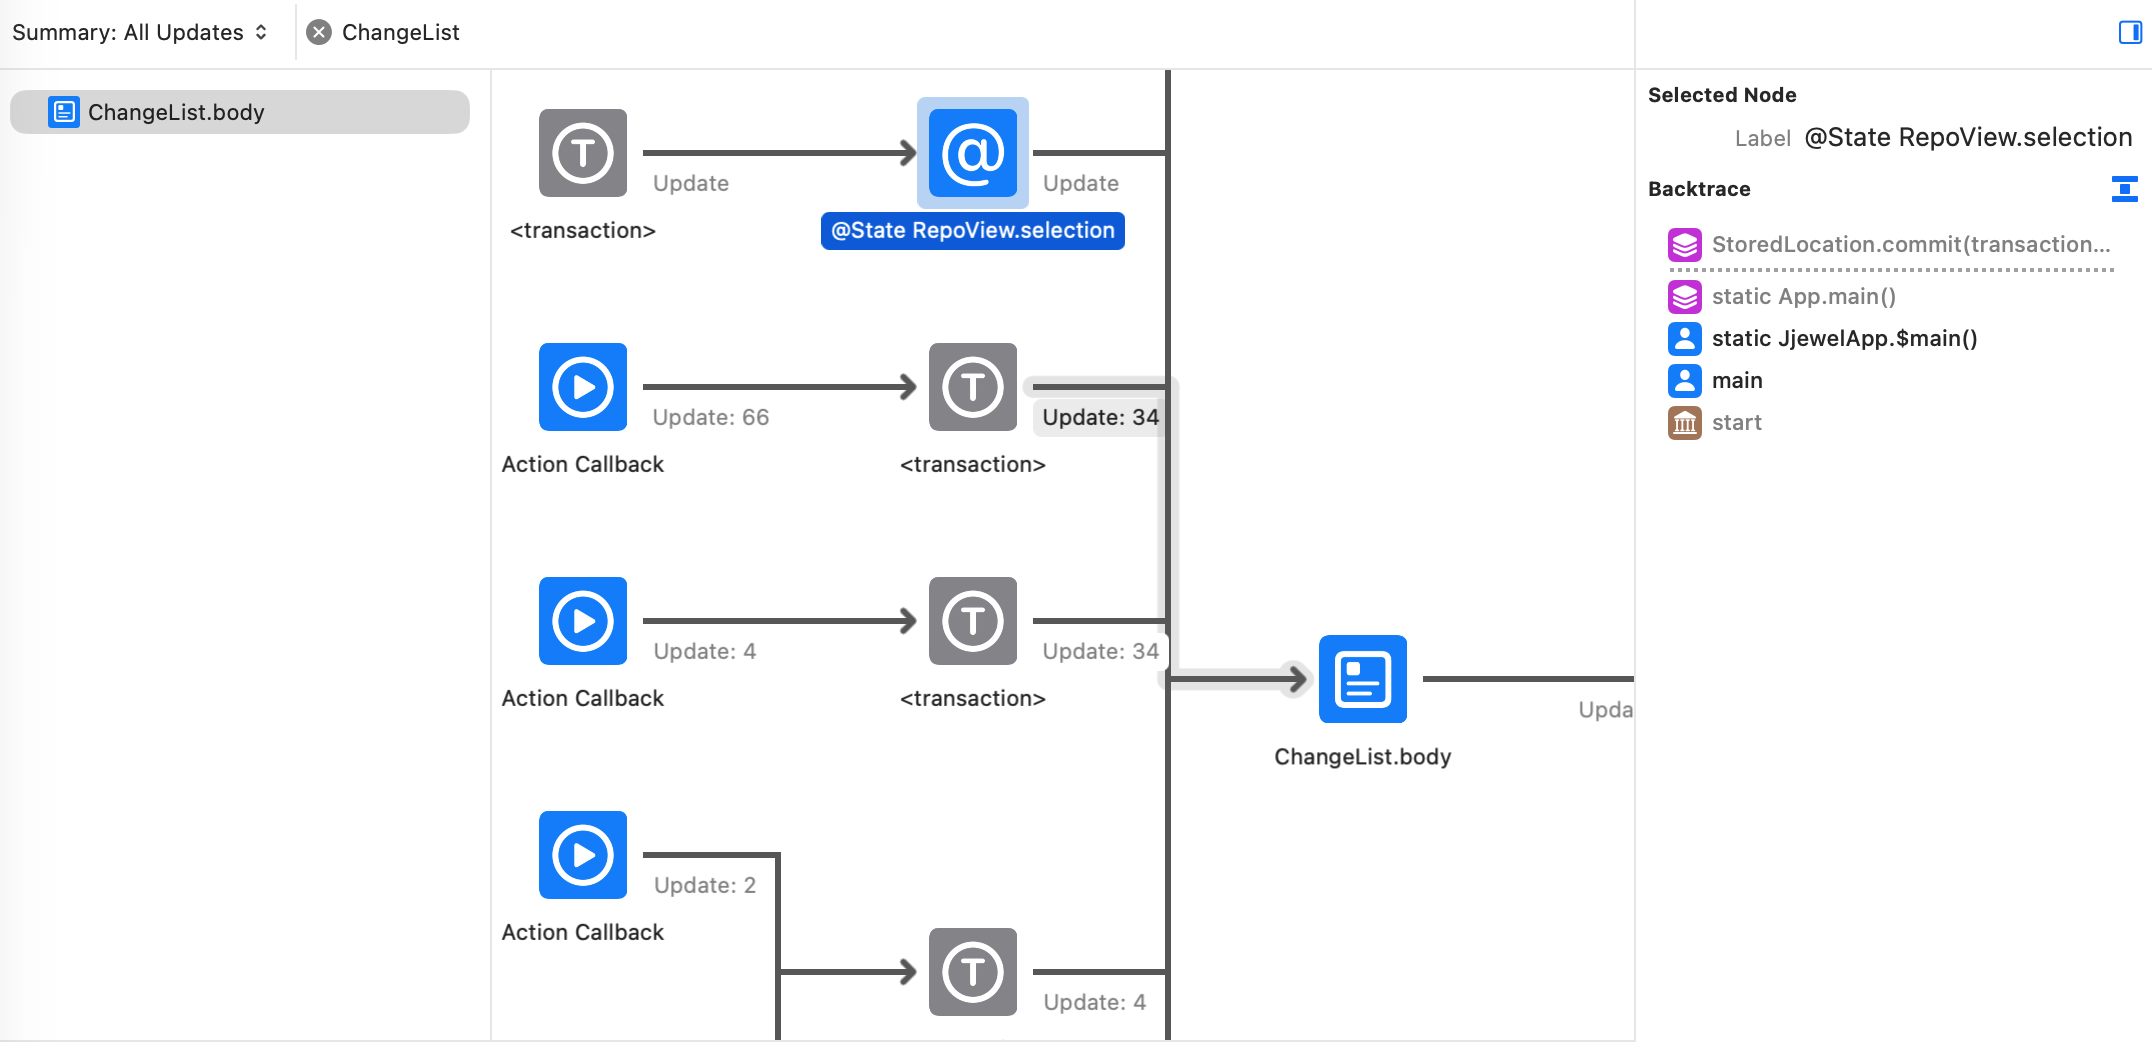
The graph consists of a collection of nodes with arrows showing the flow of events. Graph nodes for your code are blue. System-defined nodes are gray.
Initially the graph is focused on the view you selected from the summary. The nodes to the left of the view show the events that trigger the view update. The nodes to the right of the view show the effects of the view update.
To figure out what triggers an update, move left along the graph until you find other blue nodes. The most common cause of view updates is data updates. When the data the view shows changes, the view updates.
If you are not seeing any nodes to the left of a particular node, move the pointer over the node to show one or two buttons at the top of the node.
Clicking the left button toggles showing and hiding the nodes to the left of the selected node. If no buttons appear, you reached the end of a path.
Do you want to learn more about the SwiftUI instrument?
I wrote a book, Profiling Swift Apps, that shows you how to use Instruments to find and fix problems in your code. The book has a chapter on using the SwiftUI instrument to find problems in your SwiftUI code. You can learn more about the book and download a sample at the following link: