Profiling Swift Apps Book
Find and Fix App Performance Problems Using Instruments
You’re developing an iOS or Mac app. Your code builds and runs but has performance problems like the following:
- The app is slow.
- The app takes a long time to launch.
- The operating system kills the app because it’s using too memory.
Instruments is Intimidating
Xcode comes with Instruments, a tool to help you find problems in your code such as memory leaks, high memory usage, and slow running code. But Instruments bombards you with so much data that it’s hard to find where the problems are in your code.
You run the Time Profiler instrument to find the slow spots in your code and get a listing like the following:
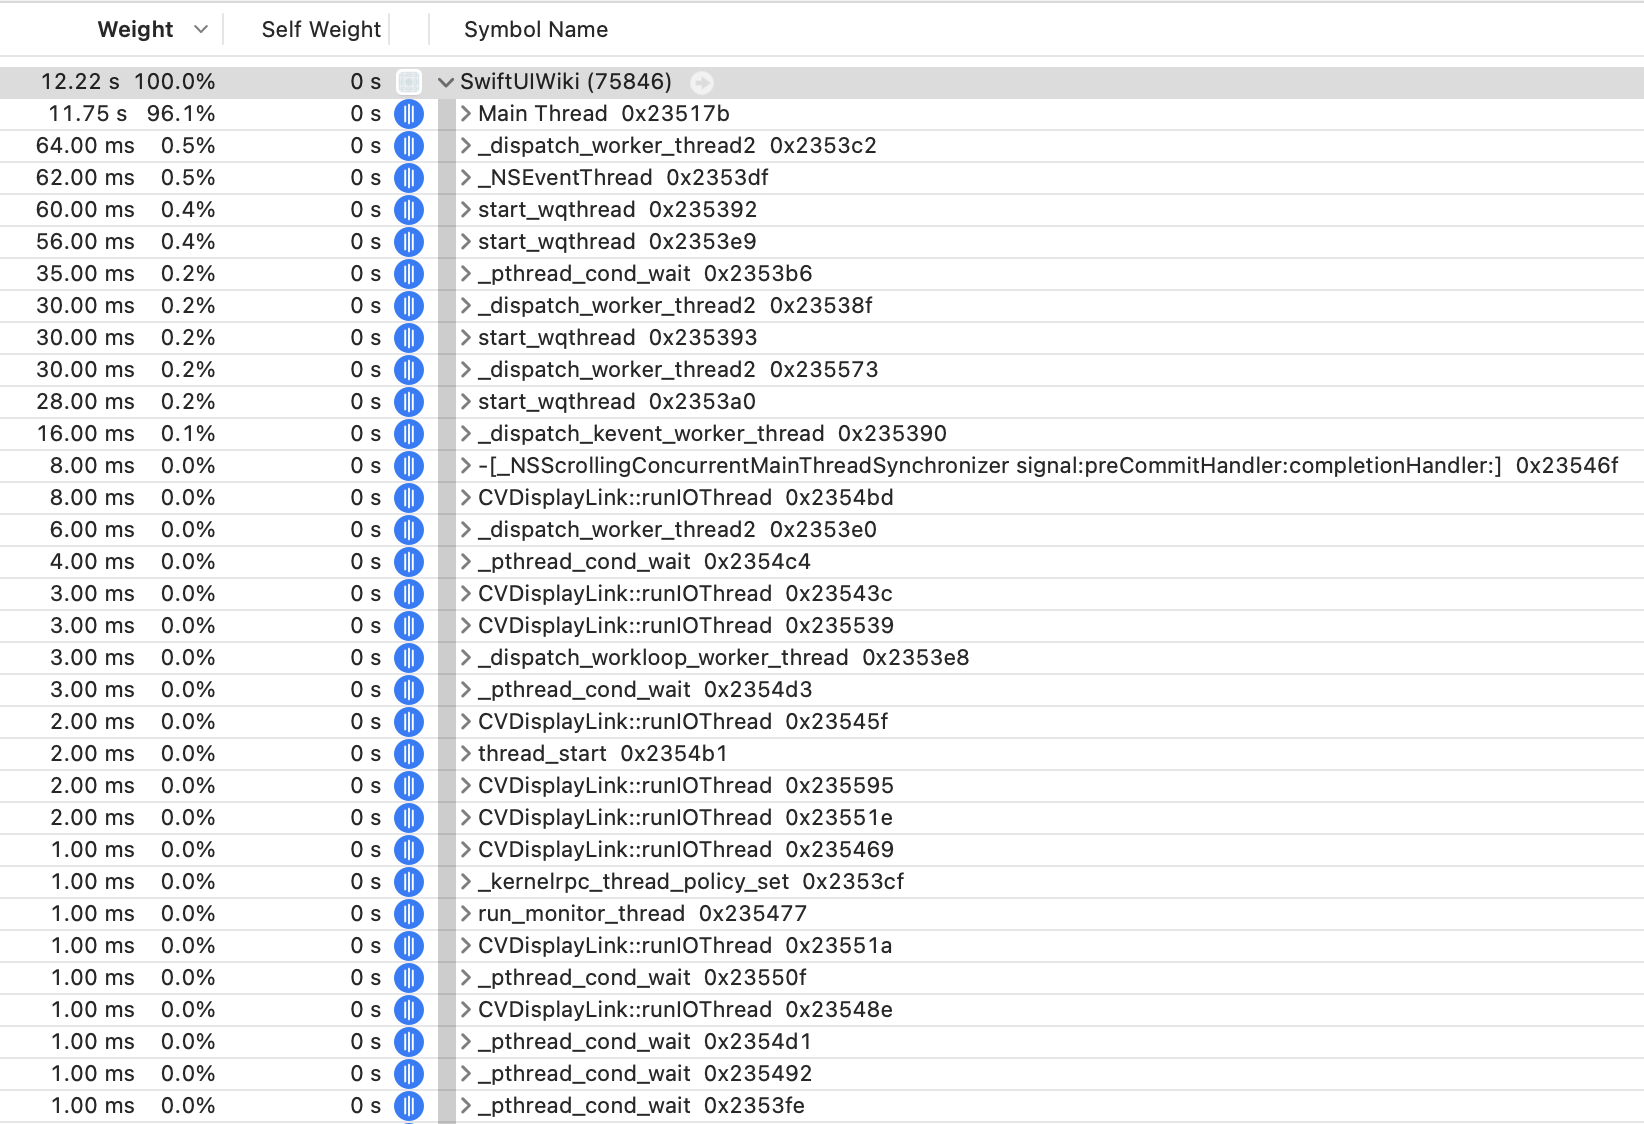
The listing shows a bunch of functions you didn’t write. How do you find your code? What’s the difference between Weight and Self Weight? What you really want to know is the code causing your app to run slowly, and Instruments shows you a list of low-level threading functions. How do you find your code?
Learn to Make Sense of Instruments and Improve App Performance
I’ve written Profiling Swift Apps, a book that helps make sense of the profiling data Instruments generates. The book shows you how to find the most important information in the Instruments data, such as the code causing problems. Some of the things you will learn in the book include the following:
- Using the Leaks instrument to find memory leaks and find the code allocating the leaked memory.
- Using the Allocations instrument to find how much memory your app uses and find the code that allocates the most memory.
- Using the Time Profiler instrument to find the slow spots in your code.
- Finding the largest memory allocations your app makes.
- Seeing if the main thread is blocked.
- Finding the SwiftUI views that update the most in your app.
- Finding what causes your app’s SwiftUI views to update.
After reading this book you will be able to use Instruments and find the code causing problems in your app. Finding the code you need to fix is the first step to making apps that run faster, use less memory, and don’t leak memory.
I wrote the book for Xcode 26 so you can be confident the book is up to date.
Book Contents
- A quick start guide to using Instruments that covers the most common things you’ll do with Instruments
- Launching Instruments and profiling your app
- Reading the profiling data Instruments generates
- Leaks instrument deep dive
- Allocations instrument deep dive
- Time Profiler instrument deep dive
- SwiftUI instrument deep dive